4 Practical Reasons to Consider Reallocating Some Assets to Gold
(May 19, 2016 - by J Clinton Hill)
Summary
Risk aversion and investor demand for gold investments signal an inflection point for asset allocation.
Zero to negative interest rate policies by 2/3 of the world’s central banks continue to facilitate further price support for gold.
Potential gold investors should not allow the market noise to deafen them to the ideas of practical portfolio insurance and cyclical asset allocation.
As a capital markets strategist, I continually monitor and compare asset classes, sectors, industries and individual securities. Lately, Gold (NYSEARCA:GLD) has garnered lots of attention, especially after its +15.95% return in Q1-2016, which closely tracked the World Gold Index @ +16.38%. Since the surging demand for gold ETFs was a major contributor to gold’s outstanding performance in the first quarter, most of my discussion on gold in this article will evolve around the GLD exchange traded fund.
Some investors are questioning if gold is "done with its run" and should chips be cashed. From a tactical perspective, this might be the case. However, from a longer-term or strategic position, chart analysis of gold, along with its performance correlation to other securities, and consideration of global fundamentals lead me to believe otherwise. Instead, I am of the opinion that the rally is just getting started and here’s why…
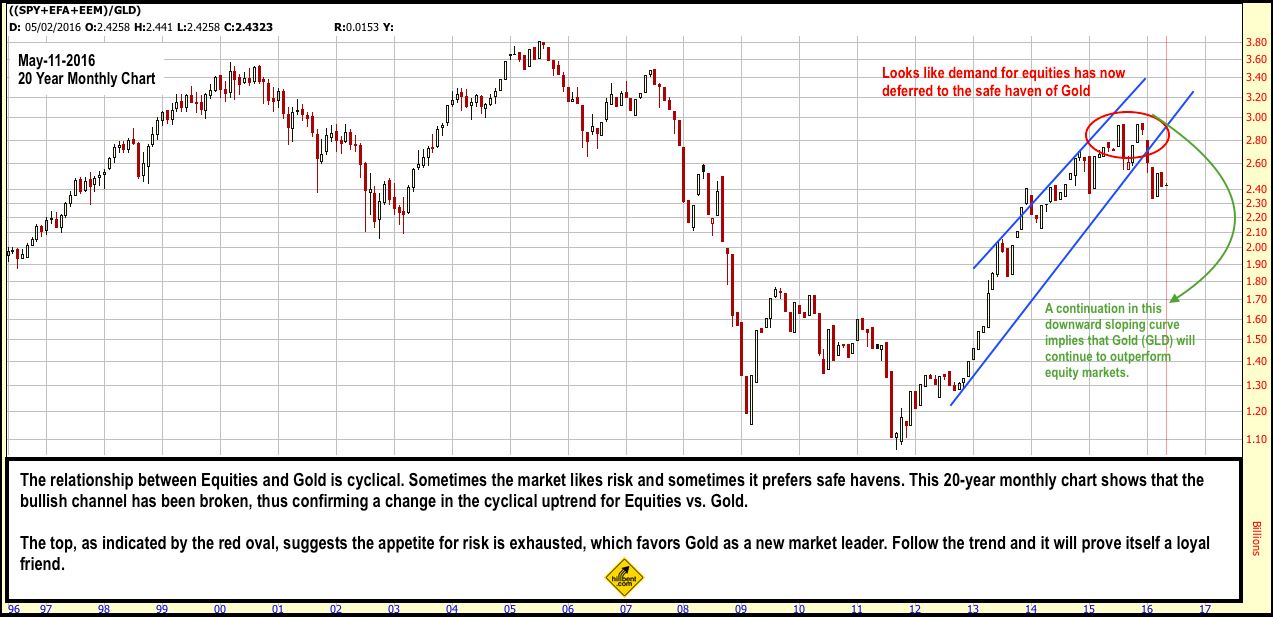
1) Cyclical Rotation of Asset Allocation: Equities as an asset class compared to gold have their bullish and bearish cycles due to underlying economic fundamentals and investor sentiment. As a proxy for equities, I used the S&P 500 (NYSEARCA:SPY), EAFE (NYSEARCA:EFA) and Emerging Markets (NYSEARCA:EEM), all three of which do a pretty good job of mimicking global capital markets. Combining and dividing their historical price data by the GLD illustrates that the markets may be at an inflection point and entering a new cycle which once again favors safe haven assets.
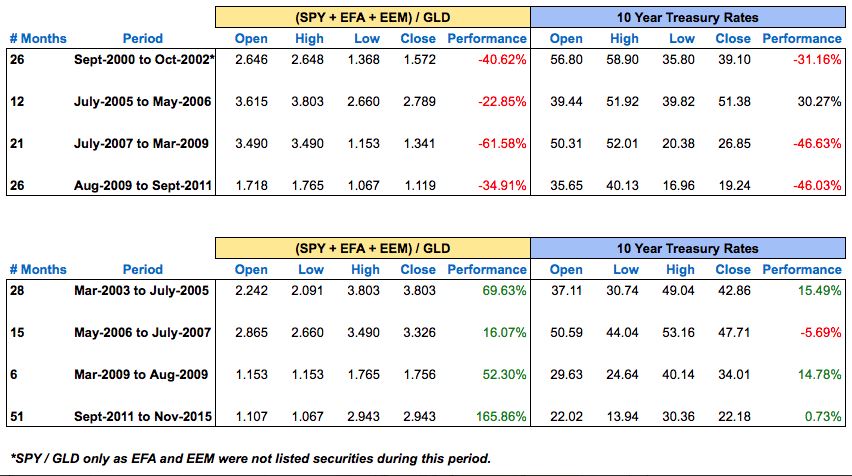
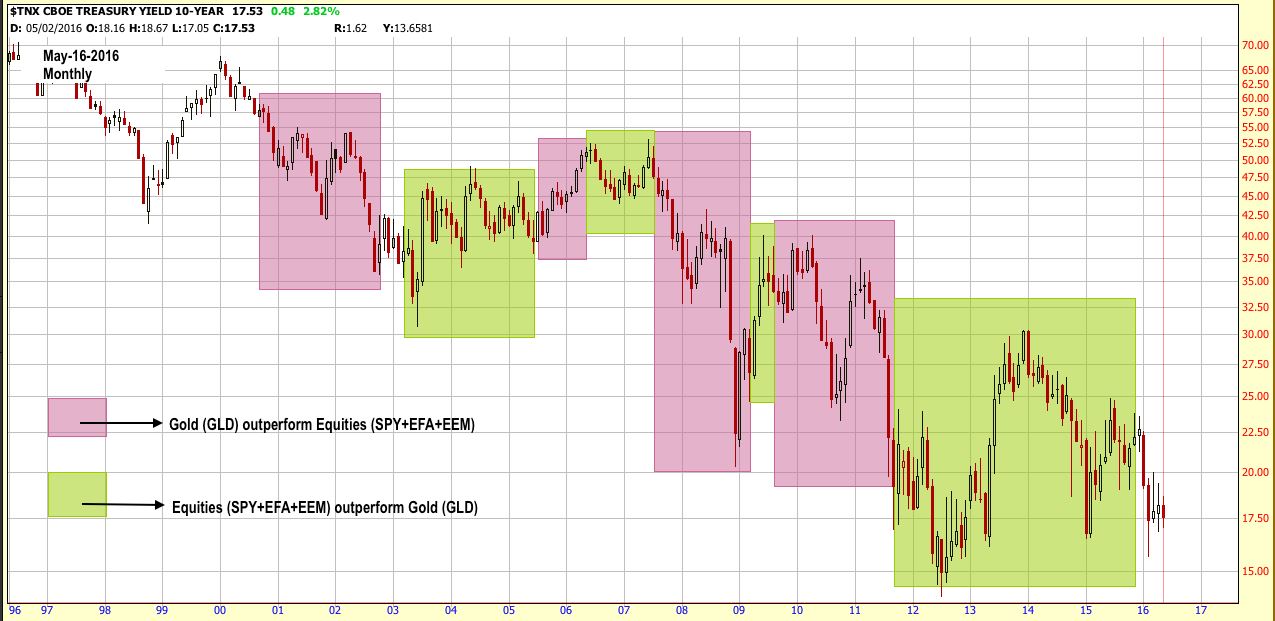
So given the secular downtrend in interest rates, one would expect gold to steadily outperform, but this has not been the case. Instead, we have cyclical swings in asset performance rotation. Gold prices are inversely driven by the direction of interest rates and also by demand and supply. One may also argue that interest rates impact demand for gold. The imbalance can also be influenced by supply factors as well, but for this post, we are more concerned with interest rates and their ability to sway investors. (see charts below)
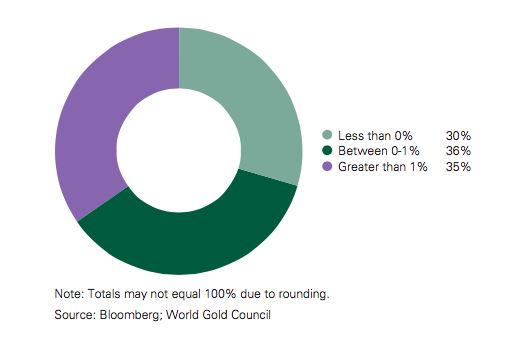
2) From ZIRP (zero interest rate policies) to NIRP (negative interest rate policies): Conventional wisdom and policy once dictated zero to be the bottom floor for interest rates. Post-great recession has completely altered the standards for normal as central banks have transitioned from a world of ZIRP to NIRP. According to Bloomberg and the World Gold Council (WGC), almost a third of central banks have implemented NIRP while another 1/3 may be categorized as ZIRP (guilty of ranging from 0% to 1%). (see chart below) Most unsettling about NIRP is not only its lack of precedence, but the implication of it being a last ditch effort of desperation to stimulate an economy after all other policies have failed.
Obviously, this is not a policy the U.S. would prefer to pursue and it would imply a much worse economy. However, Chair Yellen even once remarked in February-2016 that she would not take the idea of negative interest rates off the table, despite the possibility that such a policy might not even be legal. BOE governor, Carney, is not likely to go in that direction as well, but also had to admit that such a thing is possible.
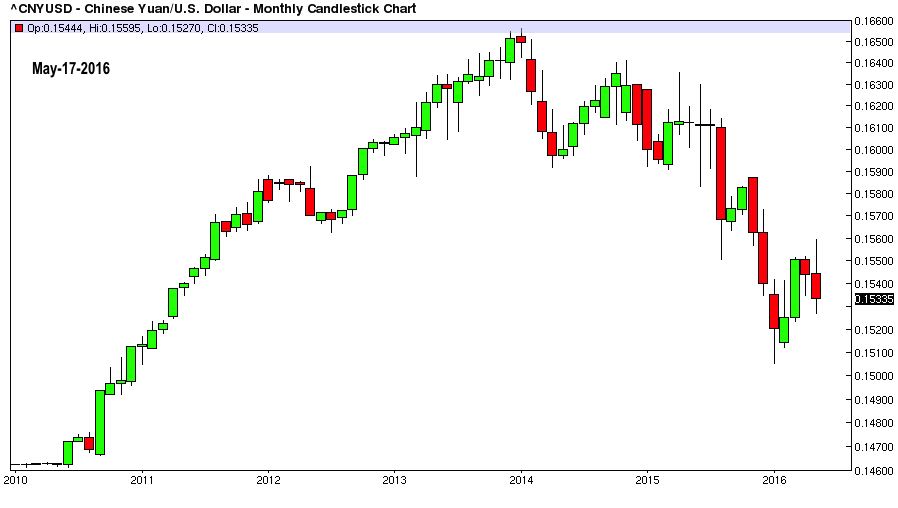
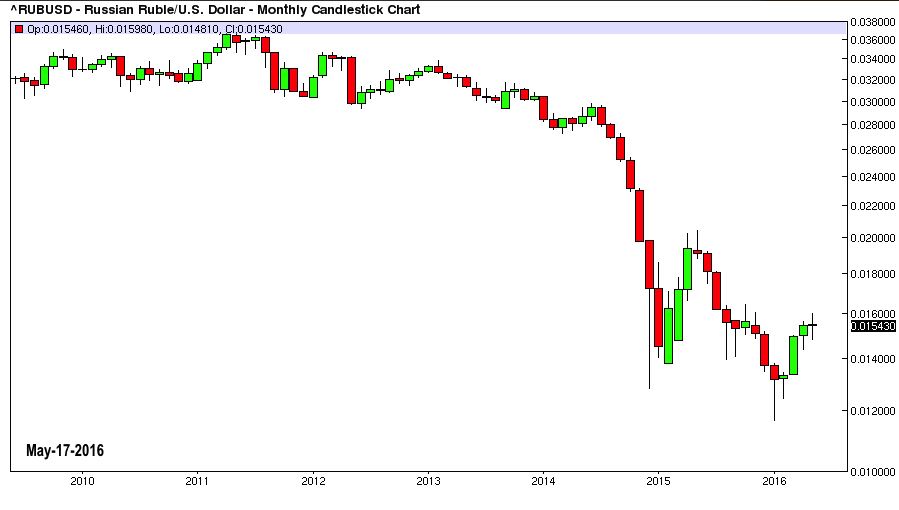
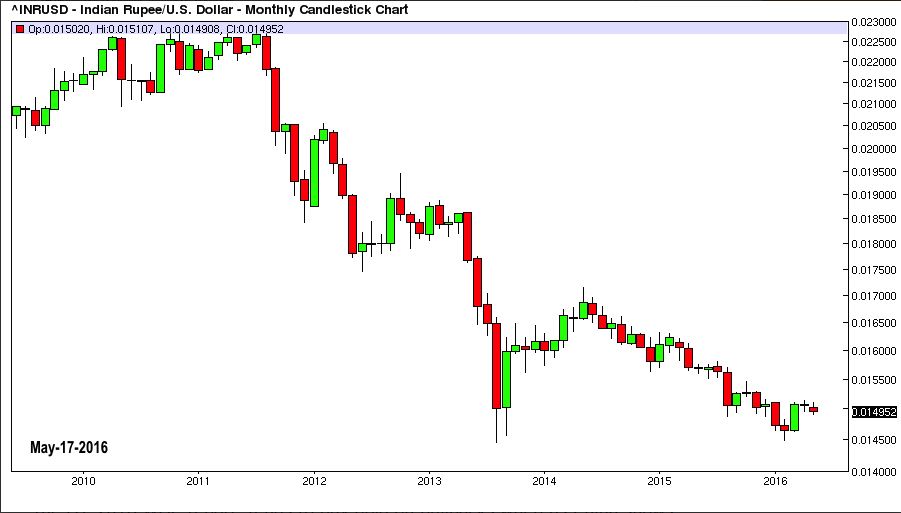
3) Uncertainty and risk aversion: The question that begs to be answered is how much further below zero can central banks take rates and what short or long term economic risks does this present ? No one knows the answer to this and therein lies the uncertainty, which has been driving investors into gold investment vehicles such as ETFs, which surged over 300% in Q1-2016 vs. last year. Even central banks are lining up to buy gold. In countries like China, Russia or India, which have been vulnerable to currency erosion, gold is traditionally sought after to mitigate risks. (see charts below)
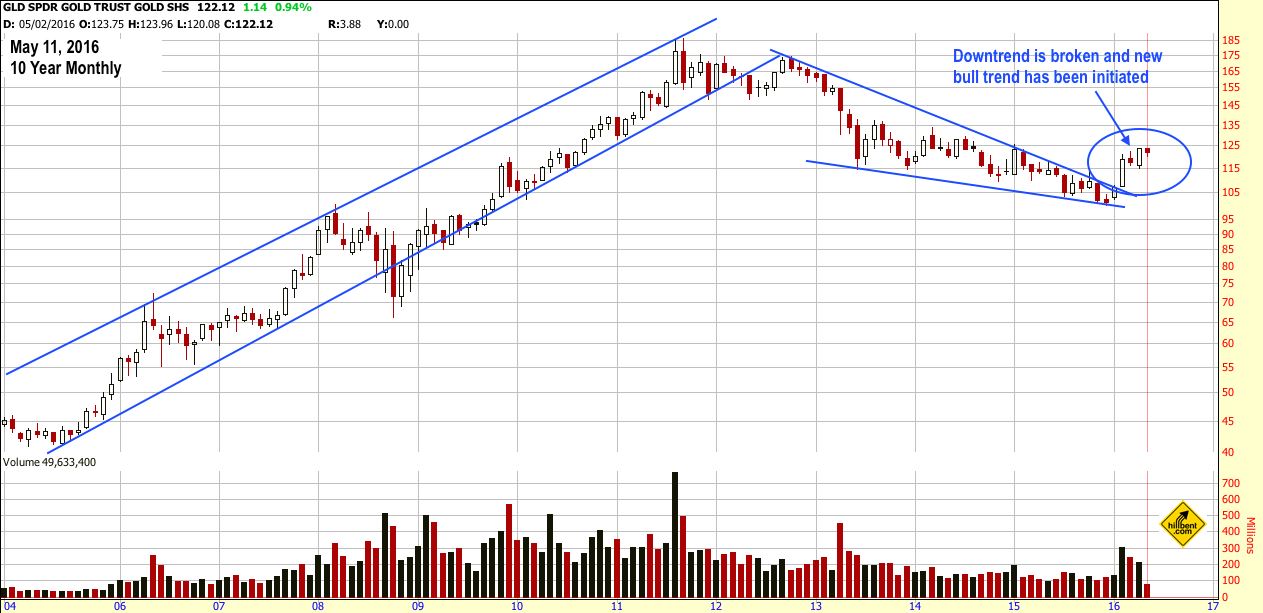
4) Technical Support for Gold: For final emphasis, I have included a chart of the GLD itself to illustrate the price support it has found to reverse its downtrend. (see chart below) At the very least, there is a high probability for a bullish retracement, especially given the global central banks’ bias towards weaker currencies. It should also be noted that India, as indicated in the Q1-2016 WGC report, tends to buy gold on pullbacks whereas China shows a pattern for buying during rising trends. Regardless of the short to intermediate market direction for gold, there is buyer demand and it will most likely attribute to price support, given the global economic fundamentals and uncertainty.
In conclusion, the above analysis is written for strategic investors with a longer-term time horizon and patience to ride out the market noise and loquacious banter of central banks. Whether deflation or inflation, there is always a place for gold to shine. Investors should not allow the market noise to deafen them to the ideas of practical portfolio insurance and cyclical asset allocation.
Disclosure: I/we have no positions in any stocks mentioned, and no plans to initiate any positions within the next 72 hours.
I wrote this article myself, and it expresses my own opinions. I am not receiving compensation for it (other than from Seeking Alpha). I have no business relationship with any company whose stock is mentioned in this article.
-
 Gold & Silver Trading In A Tight Range By
April 18 2024
-
 Gold & Silver Building A Firm Base For Next Leg Higher By
April 17 2024
-

-
 Gold & Silver Are Consolidating Recent Gains By
April 16 2024
-