Gold Prices Poised for a Break Higher?
(September, 14, 2016 - by Jeremy Wagner, CEWA-M, Head Forex)
Gold prices found support yesterday near levels we highlighted on Friday. We highlighted the $1320 area as a price zone to keep an eye on and that if a bounce occurs, it opens the door for a break above the orange resistance line near $1348.
The price action from yesterday suggests the market has recognized the $1320 zone as potential support. Therefore, we will await a break higher on smaller term gold price charts to signal the market may be starting the bull run.
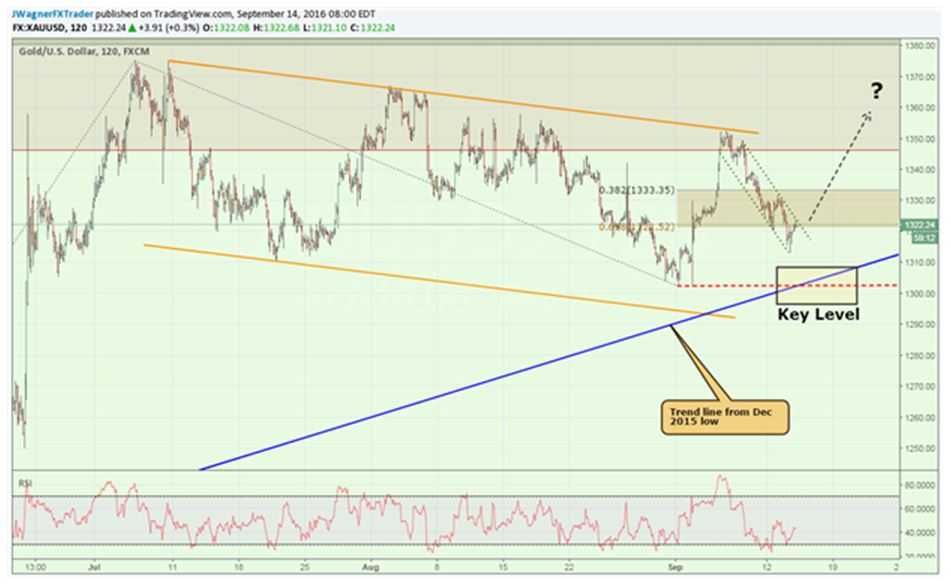
Zooming in to a smaller time framed chart, we can see a price channel has formed to the down side since September 6 high. We can use a break higher outside of this price channel as a signal to cautiously wade into the bullish waters.
A break above $1324 makes a move towards the September 12 high of $1332 higher probability. On a sustained move above $1332, the next level of resistance comes in near the orange resistance line near $1348.
If gold prices move below the blue trend line near $1302, then that suggests the near term bullish trend is over and a deeper correction is in the works.
If traders are going to entertain a break above the green price channel, start with small trade sizes then consider adding to the trade as each resistance level gets broken. A trader eventually builds the position and can be in a full position if prices succeed in breaking above the orange trend channel near $1348.
-
 Gold & Silver Trading In A Tight Range By
April 18 2024
-
 Gold & Silver Building A Firm Base For Next Leg Higher By
April 17 2024
-

-
 Gold & Silver Are Consolidating Recent Gains By
April 16 2024
-