How Does Gold React to Interest Rate Policy?
December 26th, 2019 - Mike "Mish" Shedlock's - Sitka Pacific Capital Management, LLC
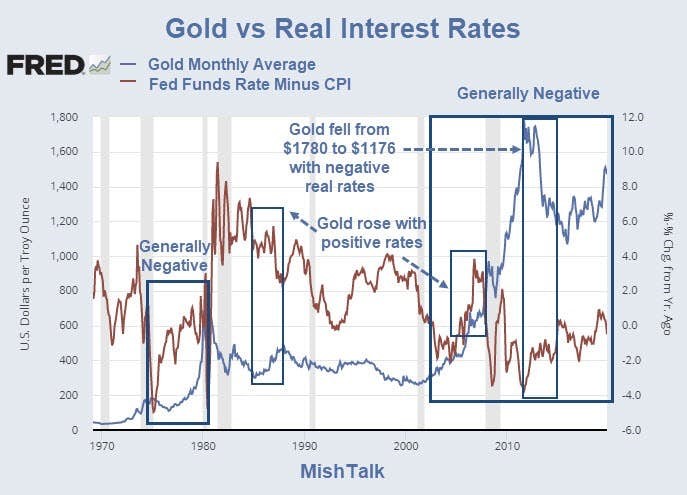
From 1970 to present let's investigate how gold reacted to various interest rate environments.
A reader asked to see a chart of gold vs "real" interest rates.
Real means inflation-adjusted. To calculate the real rate I subtracted year-over-year CPI from the Fed Fund Rate.
Use of CPI as a measure of inflation is more than a bit flawed, but it is the standard measure "real".
The price of gold is a monthly average.
No magic Rules
As one might expect, gold generally does well when real interest rates are negative as shown in the thicker blue boxes. But there is no foolproof rule.
Gold fell from $1780 to $1176 with negative real interest rates all the way.
At that time, rates were negative but they were getting less negative. However, the chart shows that gold can rise with positive real rates, and even with positive and rising real rates for shorter periods of time.
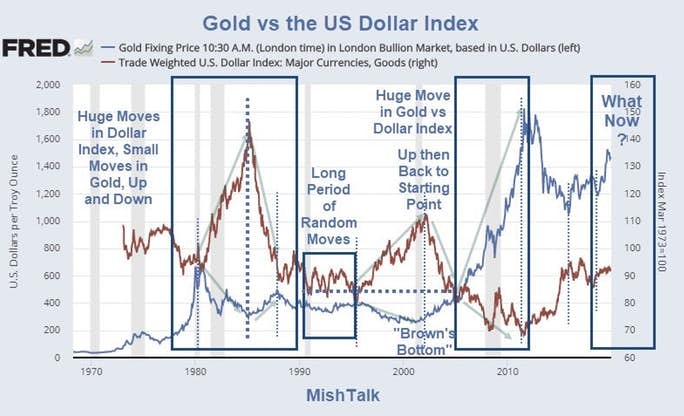
Gold vs the Dollar
Many people believe gold reacts primarily to changes in the US dollar.
Four days ago I posted Gold's vs the US Dollar: Correlation Is Not What Most Think.
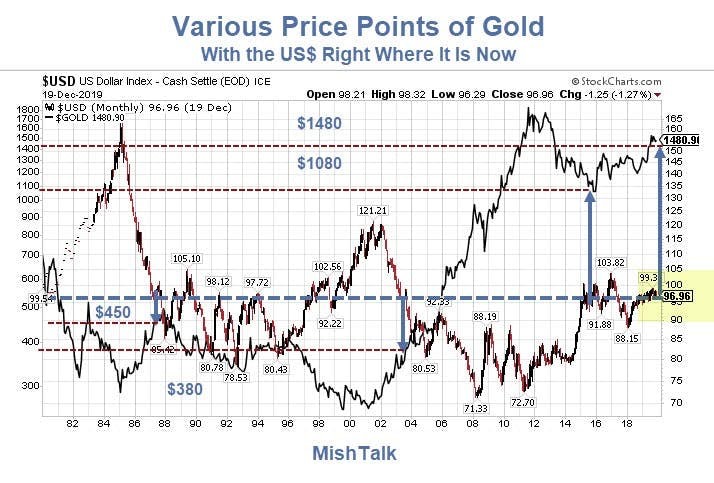
Most of the time gold is inversely correlated to the US dollar.
The problem, as the above chart shows, is that the strength of moves in gold vs the strength in moves in the US dollar are totally random.
Look at the period between 1995 and 2005. A huge jump in the dollar index yielded a relatively small decline in the price of gold.
Between 2005 and 2012 gold went on a long one-way tear up regardless of what the dollar did. The net result was a huge blast higher in gold vs the move in the US dollar index.
Various Price Points of Dollar vs Gold
That chart is from four days ago. Over the past few days, gold has blasted higher. It's at $1513 as I type.
Gold vs Faith in Central Banks
Whatever it Takes
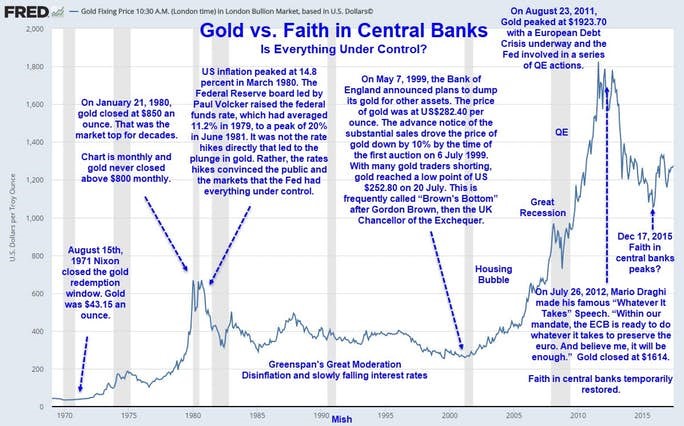
Neither the dollar or interest rate policy properly explains price movements in gold.
The big plunge from over $1600 to $1176 or so roughly coincides with ECB president Mario Draghi's famous "Whatever it Takes" speech.
"The ECB is ready to do whatever it takes to preserve the Euro, and believe me it be enough," said Draghi.
So, what do Draghi do?
Curiously, the answer is nothing other than make that statement. It was not until years later the ECB resorted to negative interest rates.
Faith in Central Banks Peaked
Looking back, Faith in Central Banks Peaked in December 2015.
Here are the events leading up to that peak.
In June of 2104, the ECB interest rate first went negative. On December 9, 2015, after a year of non-movement, the ECB unexpectedly cut rates further to -0.30.
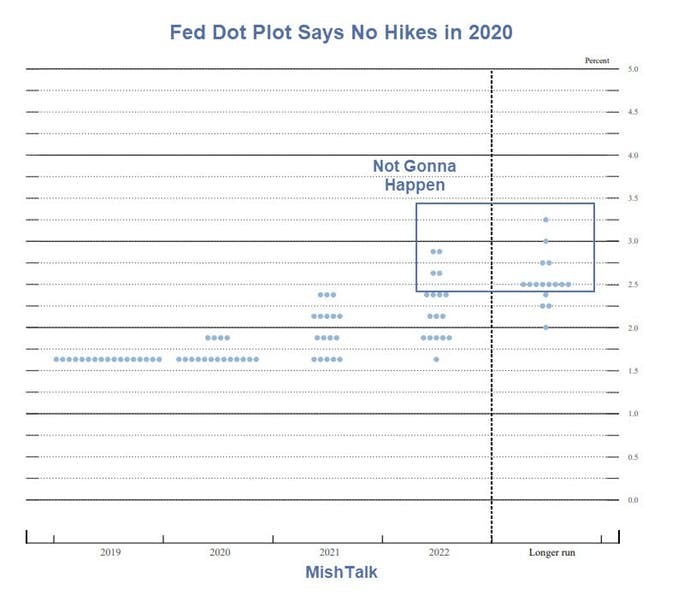
Clearly the ECB was not in control. Dot plots of the Fed's expected actions say the same about the Fed.
As the ECB was cutting rates, the Fed was tightening at a far slower pace than Fed's dot plot projections.
The Fed is now on a "long term hold".
On December 11, just after the last FOMC meeting, I noted Fed Eyes Long Pause, No Rate Hikes in 2020.'
Dot Plot Analysis - Not Hikes in 2020
Dot Plot in December 2017
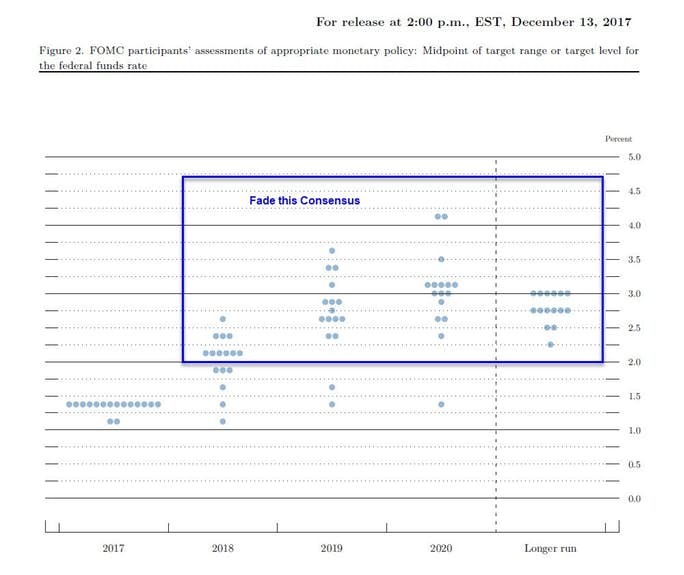
The consensus opinion was interest rates would hit 3% or higher in 2020.
The Fed did not come close.
And even though real interest rates were negative, the Fed barely got going.
Recently, we had a Repo crisis followed by emergency QE although the Fed refuses to call it that.
Looking Ahead
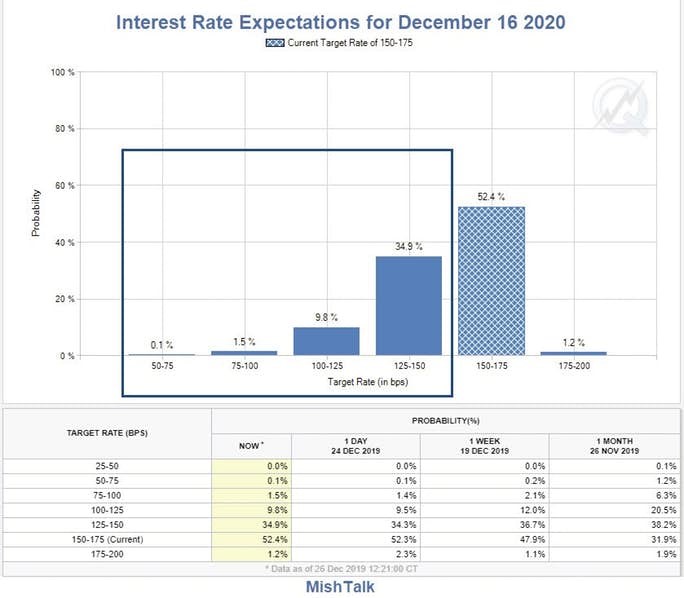
The above chart from CME Fedwatch.
The Fed says it will stand pat, but market thinks the Fed will cut even though real interest rates are negative.
I agree with the market. The Fed's next move will be a cut. If by some miracle it's a hike, then a panic set of cuts will likely soon follow.
So is faith in central banks high with everything under control?
I suggest not. This rates to be a good environment for gold.
-
 Gold & Silver Moving Above Resistance Levels By
July 22 2026
-
 Gold & Silver Moving Higher On Strong Demand By
July 21 2026
-

-
 Gold & Silver Prices Firming Above Support – July CoinStats By
July 20 2026
-
 China Gold Market Update By
July 20 2026