Silver is About to Test the Recent Positive Sentiment
(July 25, 2017 - by Tomasz Wi?niewski)
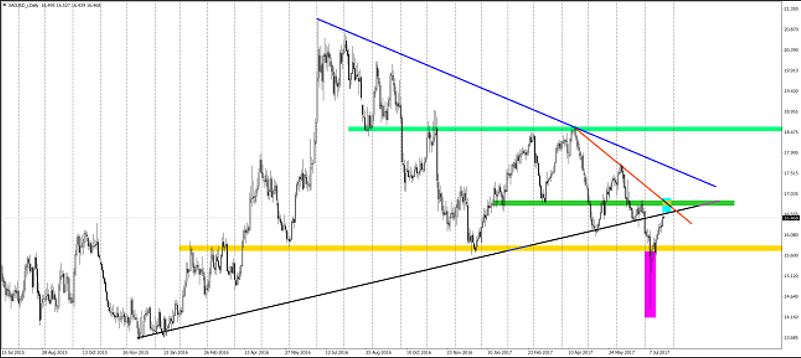
It looks like the worst is behind us. The flash crash from the 7th of July, cleared few stop loss orders for sure and many buyers were kicked out of the market. That kind of price action often happens and do not surprise experienced traders. What is left on the chart now is a false breakout, which according to the price action is a good signal to buy.
To be precise, the false breakout is a V shape reversal and which created a great opportunity for an upswing. The Silver went significantly higher and made four bullish daily candles in the last week. This allowed to quickly reach a first important resistance here (light blue rectangle), which is a combination of various technical elements. First of all we do have a black up trendline, then red down trendline and the green horizontal resistance (around 16,8 $/oz). This the area where the potential upswing can stop or have a pause. Bearish price action there will promote a take profit action (so a decline). On the other hand, breakout will be a trigger for a mid-term buy signal.
So now we wait. In the meantime, it would be nice to take a look on the Gold chart to look for more hints as both instruments are highly correlated. On Gold, the demand is now fighting with the 1259 $/oz resistance and the bullish breakout should have a positive influence on the Silver too. Keep eye on those two precious metals as being around important S/R levels creates an opportunity for a trade with good risk/reward ratios.
-
 Gold & Silver Moving Above Resistance Levels By
July 22 2026
-
 Gold & Silver Moving Higher On Strong Demand By
July 21 2026
-

-
 Gold & Silver Prices Firming Above Support – July CoinStats By
July 20 2026
-
 China Gold Market Update By
July 20 2026