Why The Coming Silver Rally Might Be The Greatest
(July 25, 2019 - Hubert Moolman)
In the last one hundred years there have been some great silver rallies. Some have been greater than others though.
The economic conditions underlining the different silver rallies were not all the same. Obviously, those that occurred during conditions most conducive to silver rallies were the great performers.
The coming silver rally could be the greatest especially since it potentially has most conditions in common with the great silver rallies.
Gold/Silver Ratio (GSR)
The most ideal time for a silver rally relative to the Gold/Silver ratio is after a major peak in the GSR and as close to the all-time high as possible. This is because the Gold/Silver ratio is to silver rallies much like cycling down a hill is compared to cycling up a hill is to a cyclist.
In other words, when you cycle down the hill you can go much faster; just like silver can go much higher when the GSR is in decline.
Note that it is important to understand that it is underlying economic conditions that manifest in the form that economic indicators (like the GSR, for example) eventually take. So, for the sake of simplicity, I refer to the economic indicator as the conditions.
Below is a image (from macrotrends.net) of a Gold/Silver Ratio chart (above) and a Silver chart (below):
The red lines mark the beginning of the important silver rallies, and the green the end. The rally that started in 1941 started at an ideal time relative to the GSR. The current silver rally potentially has this in common with the 1941 silver rally. Note that that the other rallies started at less than ideal times – they had hills to climb.
The fact that debt-levels are currently at an extreme, and that we are likely to have major stress in the credit markets make this possibility very likely. It is therefore, no coincidence that interest rates bottomed close to the start of the 1941 rally as well as the current rally.
Dow
The most ideal time for a silver rally relative to the Dow is to start after the Dow peak and as close to the high as possible. Again, one can use the cycling downhill analogy. Also, the Dow needs to trend down during the whole period of the silver rally.
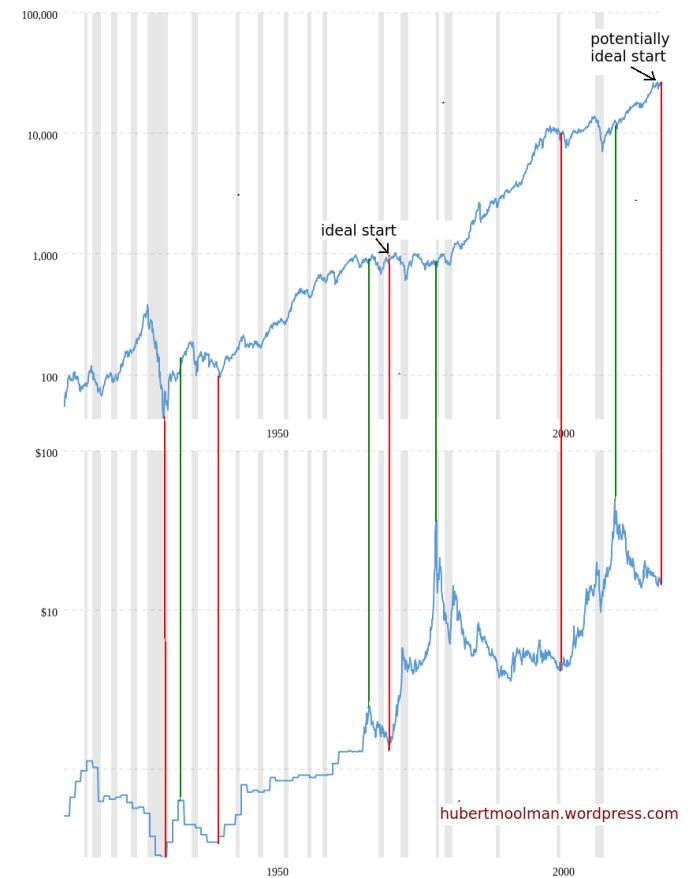
Below is an image (both from macrotrends.net) of a Dow chart (above) and a Silver chart (below):

The red lines mark the beginning of the important silver rallies, and the green the end. The silver rally that started in 1971 began at the ideal time relative to the Dow. The current silver rally also potentially has this in common with the rally of 1971, which would give it an advantage over the 1941 silver rally.
If the expected credit distress plays out, it could potentially cause the Dow to decline significantly over the coming years. This could give the current silver rally an edge over the one of 1971, since the Dow did not not have much of a net decline over the entire period of the silver rally.
Either way, it already has an edge over the 1971 rally due to it starting ideally relative to the GSR.
Interest Rates
The most ideal time for a silver rally relative to interest rates is to start after a major interest peak and as close to the low as possible. Also, it is ideal if the entire rally exists during an interest rate uptrend.
Below, is a long-term silver chart with major interest rate peaks and bottoms indicated:
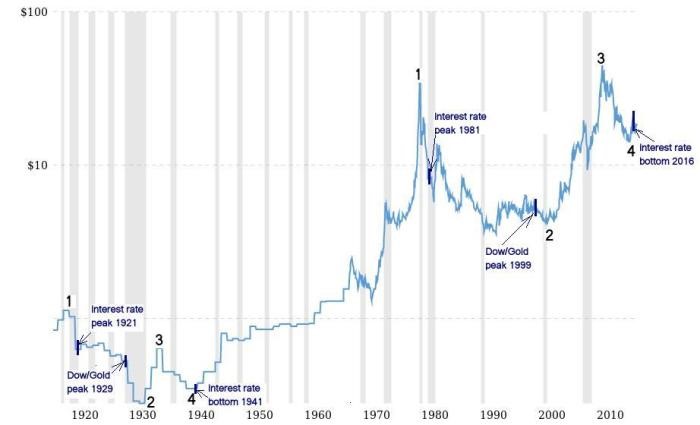
Again, the 1941 silver rally started at an ideal time relative to interest rates. The current silver rally potentially has this in common with the 1941 silver rally. However, the interest rate bottom of 2016 is lower than the 1941 bottom, and is the all-time low of at least the last one hundred years – again, giving the current rally a potential edge.
Conclusion
The current silver rally has the best ingredients to be the most explosive silver rally for the last 100 years.
-
 Gold And Silver Continue To Build Excellent Support By
July 31 2026
-
 The Day Gold And Silver Turned Bullish For 2026 By
July 30 2026
-
 China’s Gold Imports Jump 89% In First Half As Prices Retreat By
July 30 2026
-

-
