Levels To Watch In The Wild Silver Market
(September 5, 2019 - Andrew Hecht)
- Gold led the way
- Silver takes the bullish baton
- Levels to watch in the wild silver market
Silver can be a highly volatile member of the precious metals sector, at times. Both gold and silver have a long history as a means of exchange, hard currency, or real money. If gold is analogous to banknotes, silver is the change in our pockets or change purses. For many years, coins had high levels of silver content.
Silver tends to move higher or lower with the price of gold over time. Over the past week, the silver market may have awakened from a long slumber. Gold is trading at a level that is significantly above the technical resistance at the July 2016 peak. However, silver remains below its high from that year. Over the past week, the price of silver rose above the $18 per ounce level and to the highest price since April 2017.
The most liquid ETF product in the silver market is the iShares Silver Trust (SLV) with net assets of $5.87 billion.
Gold led the way
The price of gold broke above its critical level of technical resistance at the July 2016 high at $1377.50 per ounce in mid-June. The US central bank told markets to expect short-term interest rates to decline before the end of 2019, which lit a bullish fuse under the yellow metal. Meanwhile, silver could not even make it to a new high for 2019 above its first level of technical resistance at $16.20 until mid-July.
On July 31, the Federal Reserve cut the short-term Fed Funds rate by 25 basis points and ended its program of balance sheet normalization. The following day, President Trump escalated the trade war with China by slapping a new set of tariffs on Chinese exports to the US. Falling rates and the potential for a global recession sent the price of gold above $1500 per ounce for the first time since 2013. The price of silver moved higher but remained below the 2018 peak at $17.705 per ounce.
Silver takes the bullish baton
On August 26, the price of gold rallied to a new and higher high at $1553.40 per ounce. However, silver took over as the leader as the price burst through the $18 per ounce level.
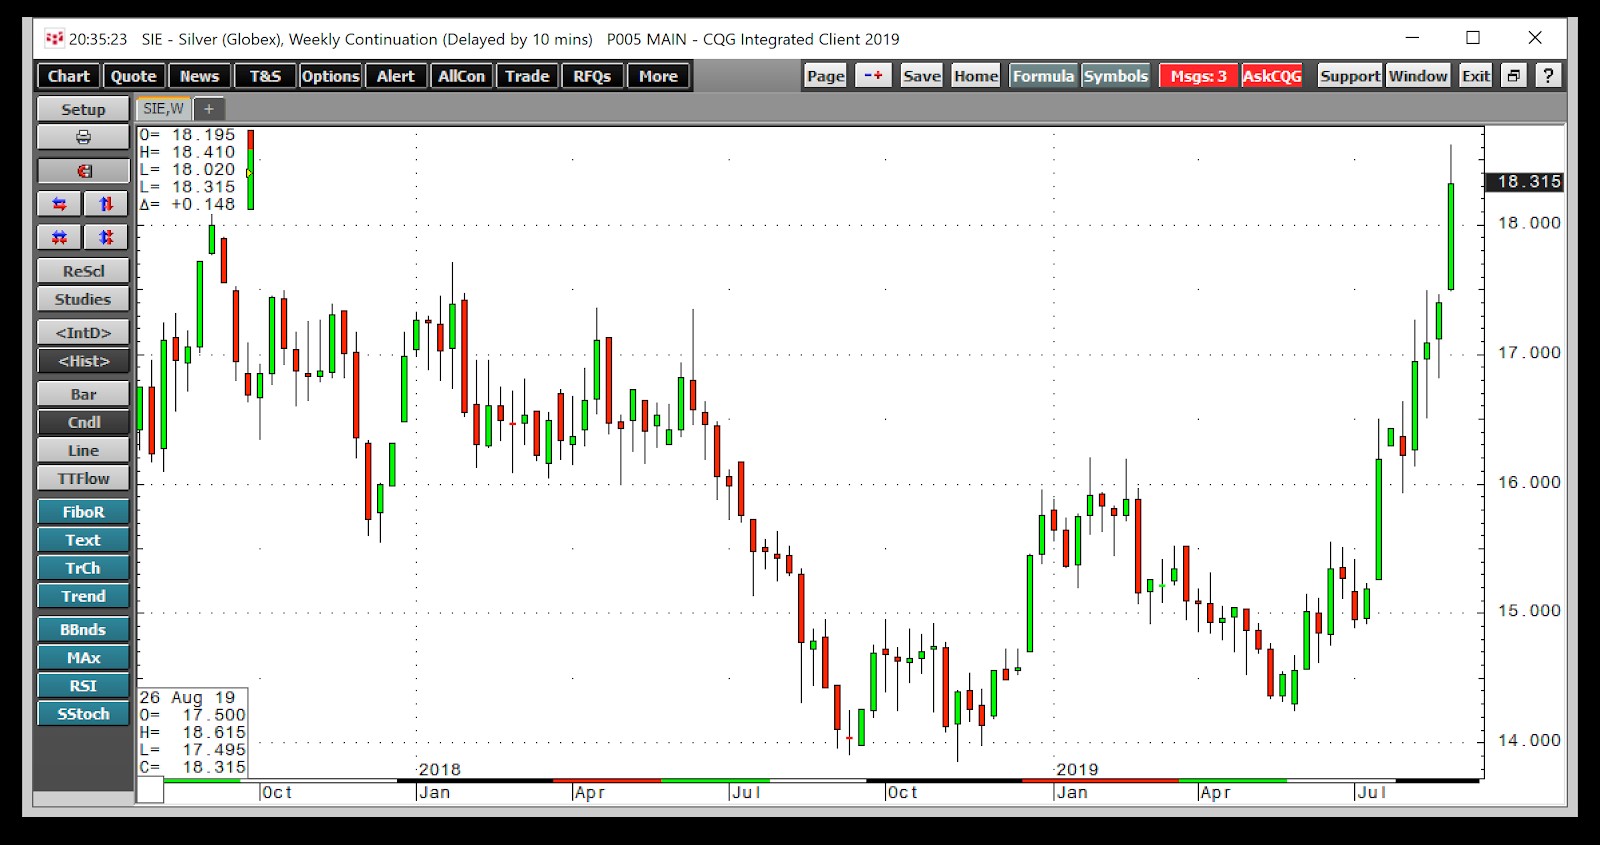
(Source: CQG)
As the chart shows, silver moved to a high at $18.615 per ounce on the continuous futures contract last week and settled at over $18.30 on the final day of August. Silver futures posted a 5.3% gain last week while gold was just 0.28% lower. At the high, silver came within four cents of the 2017 high, which is the next technical target on the upside.
Levels to watch in the wild silver market
Silver is a market that moves higher and lower on sentiment. Speculators and investors flock to silver when the price begins to trend. Therefore, we could be on the verge of a feeding frenzy in the silver market if gold continues to rally over the coming weeks and months. Above the 2017 high at $18.655 per ounce, the July 2016 peak at $21.095 is the critical technical line in the sand for the price of silver. Gold already blew through its 2016 highs like a hot knife goes through butter and is at the highest level since April 2013. During that month, the price range in the silver futures market was from $22.00 to $28.36 per ounce. At the same time, a return to the long-term average in the silver-gold ratio at 55 ounces of silver value in each ounce of gold value would put the price of silver at $27.69 per ounce with gold at $1523 on August 30.
Silver has broken higher, but the real test for the market will be if it can climb above the 2016 peak at just over $21 per ounce.
-
 Gold And Silver Continue To Build Excellent Support By
July 31 2026
-
 The Day Gold And Silver Turned Bullish For 2026 By
July 30 2026
-
 China’s Gold Imports Jump 89% In First Half As Prices Retreat By
July 30 2026
-

-
