Gold-Silver Ratio Says Go For The “Grey Metal”
(June 6, 2019 - Dan Atkinson)
 (June 6, 2019 - Dan Atkinson)
One of the oldest sayings in financial markets is that anyone contemplating investing or trading in commodities ought to lie down in a darkened room until the feeling passes.
Some would add that advice goes twice over if the commodity in question is silver.
The “grey metal”, they say, can be a money trap, an unstable asset that is bought by different purchasers for completely different and conflicting reasons, whose production does not respond to demand signals and which should be given a wide berth.
Buy low, sell high
Furthermore, say critics, it is hitching a ride on the prestige of gold as an asset by describing itself as “silver bullion” when, in fact, it is simply a glorified industrial metal.
That’s quite a charge sheet, but despite all this naysaying, silver retains a fascination for specialist investors and traders. Should you wish to join their number, there is a useful tool for judging the next price movement: the gold-to-silver ratio.
The gold-silver ratio measures the number of ounces of silver needed to buy an ounce of gold, although it can be calculated without reference to a pair of scales by simply dividing the gold price by the silver price.
So far so good.
Now, the old adage, to buy low and sell high comes into play here, so the more silver needed to buy gold, the cheaper is silver at that moment.
Let’s have a look at the gold-silver ratio history. According to the gold-silver ratio charts, on 8 June 2009, the ratio stood at 62.881, which is neither high nor low in historic terms, falling to a very low 32.273 on 25 April 2011.
This latter figure probably reflected gold demand fuelled by the on-going financial ructions, not least the banking crisis in Europe and the looming loss of America’s AAA credit rating.
By 12 October 2015, the gold-silver price ratio was back at 73.519.
So how did the price respond? Well, from $13.44 an ounce on 5 June 2009, the price took off to $46.47 by 27 March 2011.
Robin Hood at the movies
This, in turn, triggered that very low ratio seen in April 2011, which seems to have acted as a signal to sell silver – the price dropped to $15.56 by 2 October 2015, which explains that higher ratio of 73.519.
Despite a flurry to $20.29 in June 2016, the price has been in the doldrums since, and is currently about $14.86. Meanwhile, the number of silver ounces needed to buy an ounce of gold has soared through the psychologically important 80 barrier at the end of last year and now stands at above 89.
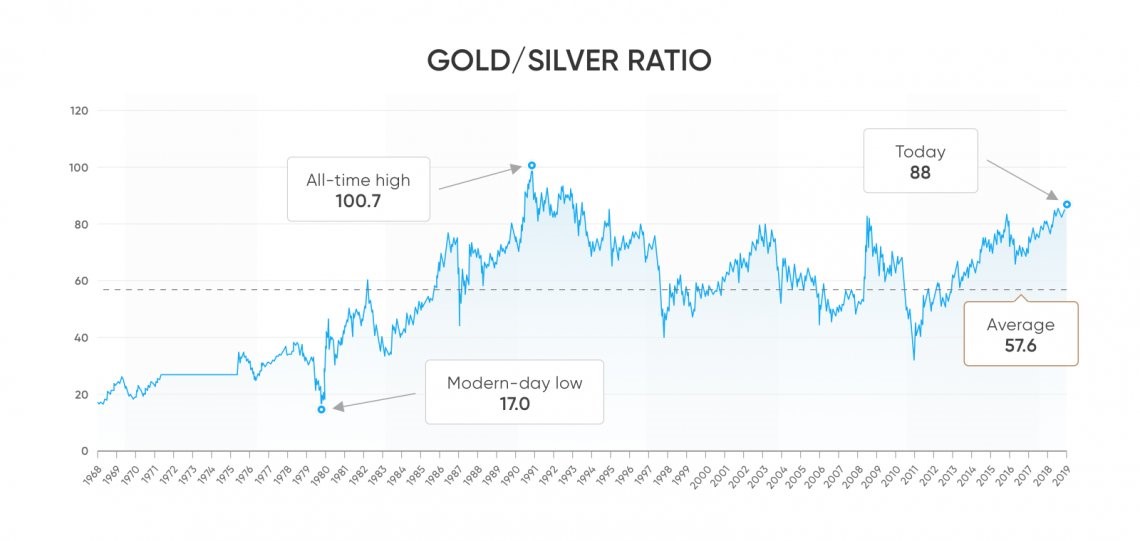
This is the highest level since 1991. For any youngster readers, that was the year America and her allies, led by the first President George Bush, recaptured Kuwait from Iraq and Robin Hood: Prince of Thieves was a box-office smash hit.
This ratio level matters, because market wisdom has it that anything above 80 is a screaming buy signal, reflecting, as it does, an under-pricing of silver and an over-buying of gold.
Should you pile in? Quite possibly, but first a few cautionary points.
One, as we saw above, a very high ratio does seem to trigger silver buying, as traders and investors take advantage of a low price to load up on the grey metal. But the omnipresent warning applied to stock-market investment – that past performance is no guarantee of future success – is equally applicable to commodity markets, including the silver market.
Two, those with long memories may recall that, at least once during the last 30 years, market experts have claimed that the silver ratio has “adjusted”. In other words, it could adjust again, meaning an 80 ratio may no longer be the green light to buy silver.
Three, the criticisms with which we began this article may be exaggerated, but they are not entirely unfair. According to specialist company BullionVault, more than half of global silver demand is for industrial purposes, far more than the 10%-15% industrial demand for gold.
That means silver prices are influenced by global economic growth to a much greater extent than the price of gold. It is far from being a pure investment medium.
Four, it is quite true that silver is largely found in the ores of other metals, such as copper and lead. As a result, production can run at levels in excess of demand, given that silver is being pulled out of the ground anyway, leading to over-supply.
Research is essential
Finally, silver has a reputation as a metal that attracts reckless speculators, such as the Hunt brothers, who tried to corner the market in the US in the late Seventies and early Eighties.
This last objection can be dismissed in the 21stCentury – silver’s speculative attraction to Americans arose from a ban on US citizens holding gold, imposed in 1933, thus silver was the substitute asset. The gold ban was lifted in 1974.
As for the others, they certainly need to be borne in mind, although it is worth remembering that gold has its own industrial uses that may well increase in the future and that it, too, is liable to over-production, given the long investment horizons of the mining industry.
Go back 20 years, and silver has broadly mirrored the performance of gold, desperately low at the turn of the Millennium as paper assets boomed, then recovering strongly during and after the financial crisis and drifting off somewhat since, although to nothing like the rock-bottom levels seen in the early 2000s.
The point of the historical gold-to-silver ratio is not that it shows the two precious metals moving in different directions but to identify trigger points at which one is under-priced compared with the other. In this regard, it can be a valuable aid for anyone interested in trading this beautiful and bewitching metal.
But there is no substitute for proper research. The ratio is a tool. It is not a silver bullet.
-
 Gold & Silver Moving Above Resistance Levels By
July 22 2026
-
 Gold & Silver Moving Higher On Strong Demand By
July 21 2026
-

-
 Gold & Silver Prices Firming Above Support – July CoinStats By
July 20 2026
-
 China Gold Market Update By
July 20 2026