Silver Is Due for An EPIC Mean Reversion Relative to Gold
(May 4, 2020 - Adam Hamilton - Zeal LLC)
After being pummeled to record-low levels relative to gold, an epic silver mean reversion higher is underway. Here are the details…
Silver is powering higher in a new bull market after getting clobbered in March’s stock panic. Investors have been flocking back to silver in the aftermath of that ultra-rare extreme-fear event. That brutal selloff also utterly wiped out speculators’ upside bets in silver futures, giving them massive room to buy back in. After being pummeled to record-low levels relative to gold, an epic silver mean reversion higher is underway.
A couple weeks ago, I wrote a popular essay “Big Silver Bull Running!”. It explained what happened to silver in this recent COVID-19 stock panic, and why silver soared in its wake. Sucked into that blinding fear maelstrom, silver was thrashed to a miserable 10.9-year low. This metal plummeted in a near-crash, fueled by speculators’ fastest long purge ever witnessed! That exhausted their selling, totally resetting longs.
That meant these super-leveraged traders’ capital firepower was fully available to buy back into silver. And much more bullish than that, strong and relentless silver investment demand emerged since that mid-March collapse. That’s evident in the soaring silver-bullion holdings of silver’s leading exchange-traded fund, the SLV iShares Silver Trust! This dominant silver ETF is the best daily proxy for global investment demand.
The remarkable capital inflows pouring into silver through that major SLV conduit from American stock investors were explored in depth in that recent essay. But with surging investment demand as evident in SLV’s holdings its primary thesis, I only had room to tangentially touch on another very-important bullish silver factor. That’s silver’s relationship to its overwhelmingly-dominant primary driver, gold price trends.
This white metal has always tended to mirror and amplify whatever is happening in the yellow one. Silver effectively acts like a gold-sentiment gauge. Traders’ enthusiasm for silver mounts when gold is rallying on balance, leading them to bid silver higher well-outperforming gold. Since the world silver market is tiny compared to gold’s, worth just a small fraction in any given span, capital inflows fuel outsized silver gains.
But when gold is generally drifting lower, or grinding sideways long enough to shift sentiment to bearish, silver is abandoned. Speculators and investors alike are only interested in silver when they expect gold to continue materially advancing. With silver joined at the hip with gold psychologically, it tends to leverage significant gold moves by 2x to 3x. And where silver trades relative to gold is analogous to its valuation.
The best time to buy silver is when it is abnormally-inexpensive compared to prevailing gold levels. That can be measured through a simple construct called the Silver/Gold Ratio. But dividing silver prices by gold prices yields tiny hard-to-parse decimals like 0.0089 this week. So I’d rather use an inverted-axis Gold/Silver Ratio instead, which yields the same data in a much-easier-to-understand format like 112.1x.
The recent stock panic’s extraordinarily-extreme impact on silver is really illuminated by this SGR proxy. This chart shows how silver has fared relative to gold over the last decade-and-a-half or so. When this SGR line is rising, silver is outperforming gold. The opposite is true when the SGR falls, gold surpasses silver. This chart is jaw-dropping, revealing exceedingly-anomalous SGR levels which are wildly bullish for silver!
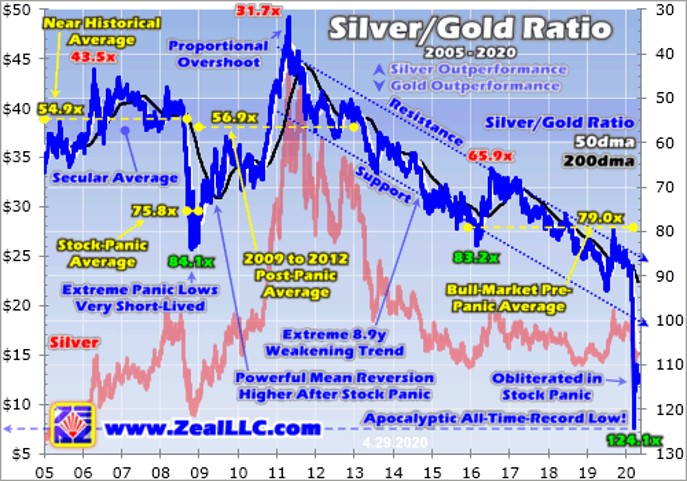
When silver plummeted to that extreme 10.9-year secular low of $11.96 on March 18th during the stock panic, the SGR soared to 124.1x! In other words, it took 124.1 ounces of silver to equal the dollar value of a single ounce of gold. That radical collapse literally forced the SGR off the charts! For over a century, about 100x was the ultra-rare SGR edge-case limit. Now all the long-term SGR charts have to be redrawn.
Our daily silver and gold data extends back to June 1969, an immensely-long 50.9-year secular stretch. Before March 2020’s stock panic, the worst SGR witnessed in that past half-century was 100.3x way back in February 1991. That only lasted two trading days before silver mean reverted back higher relative to gold. Our monthly silver and gold data runs much farther back to 1915. The SGR hit 97.3x in 1940 and 1941.
So in the 105 years leading into March 2020, the SGR had briefly challenged 100x precisely twice. And I’ve seen multi-century silver and gold charts cobbled together despite data becoming increasingly sparse the farther back in time peered. They imply this crazy 124.1x seen in mid-March was an apocalyptic all-time-record low in silver relative to gold! We just witnessed something so extreme it has never happened before.
Speculators’ most-extreme silver-futures long dump ever fueled silver’s near-crash, which obliterated this white metal to its most-extreme lowest levels ever compared to prevailing gold prices. Silver had never been cheaper relative to gold! This wildly-unprecedented anomaly is incredibly bullish for silver. All past low-silver-price SGR extremes have been followed by massive mean reversions higher in subsequent years.
The last modern example came after the previous stock panic in October 2008. These ultra-rare selling events spawn such overwhelming fear that they suck in everything else including gold and silver. In the same single-month span where the flagship US S&P 500 stock index plummeted 30.0%, silver collapsed 32.6%! That catapulted the SGR to 84.1x that month, which was a 13.6-year SGR high or silver-to-gold low.
Financial markets abhor extremes in long-term relationships. They not only never last long, but prices almost immediately start mean reverting back towards normal ratios after they are dragged way out of whack by anomalous shocks. And there is nothing more extreme than ultra-rare stock panics. The epic fear necessary to fuel them is so far beyond normal that there have only been 3 in the last 113 years!
The incredible carnage the frantic stock-panic mass selling inflicts on silver only lasts as long as peak fear in stock panics. And that is really fleeting since extreme fear quickly burns itself out. Once that initial overwhelming wave of fear passes, silver immediately begins mean reverting back higher absolutely and relative to gold. Silver bull markets grow enormous after stock panics, mean reverting before overshooting.
The Silver/Gold Ratio, and indeed many long-term price relationships, are like pendulums. Equilibrium is the long-term average, analogous to a pendulum hanging straight down at rest. The farther a pendulum is pulled to either side, the extremes, the faster and more forcefully it swings back down into its arc’s bottom mean. But its kinetic energy, like momentum in the markets, propels the pendulum to the opposing extreme.
In the years leading into late 2008’s stock panic, the SGR averaged 54.9x. That was right near the long-term secular mean as well, which ran 54.5x between 1970 to 2007. So for many decades both gold and silver miners used an SGR of 55x to convert byproduct production of their secondary metal into equivalent ounces of their primary one. When a relationship exists for decades, there’s good fundamental reason.
But like that pendulum, silver prices relative to gold’s didn’t just stop near 54.9x after silver’s super-low extremes during 2008’s stock panic. Instead they kept powering higher long after the mean, overshooting proportionally to the opposing one! If you pull a pendulum to the left, it’s going to swing back to roughly the same height on the right before running out of steam. Silver’s last post-panic bull market was huge.
In absolute terms silver more than quintupled out of its stock-panic lows, skyrocketing 442.9% higher over the next 2.4 years into April 2011! Silver far outperformed gold in that post-panic mean reversion and overshoot, with the panic-bottom 84.1x SGR blasting through that longstanding 54.9x mean to soar way up to 31.7x when that post-panic silver bull ultimately crested! Silver’s potential after stock panics is epic.
Investors flood back into silver for years after these ultra-rare extreme-selling events deeply scar them psychologically. A stock panic is technically a 20%+ S&P 500 plummeting in 2 weeks or less. Falling that fast spawns such mind-boggling fear that the total decline is often around a third in about a month! When stock investors suddenly and catastrophically lose that much of their wealth, they are forever changed.
-
 Gold And Silver Continue To Build Excellent Support By
July 31 2026
-
 The Day Gold And Silver Turned Bullish For 2026 By
July 30 2026
-
 China’s Gold Imports Jump 89% In First Half As Prices Retreat By
July 30 2026
-

-
