Exceptional Growth in Key Sectors Leads to Record High Silver Demand in 2015
(May 5, 2016 - by The Silver Institute)
The silver market saw record demand in 2015, with the jewelry, coin and bar, and photovoltaic sectors posting new highs, helping to boost total silver demand to 1.17 billion ounces last year. Overall silver supply to the market was lower, led by the continued weakness in silver scrap sales. Last year’s supply and demand scenario led to the third successive annual silver market deficit, reaching 129.8 million ounces (Moz), more than 60 percent larger than 2014 and the third largest on record. These findings, and other components of the silver market, are discussed in World Silver Survey 2016, released today by the Silver Institute and produced on its behalf by the GFMS Team at Thomson Reuters (GFMS).
Silver Demand
Globally, silver jewelry fabrication increased for the third consecutive year to post a fresh high at 226.5 Moz. This increase was largely achieved on the back of an impressive 16 percent rise from both India and Thailand, while North America posted a 5 percent annual increase. These gains were partially offset by a sizable contraction in Chinese jewelry offtake. Total silverware fabrication enjoyed its third successive annual rise to an estimated 62.9 Moz, a ten-year high.
The largest component of physical silver demand, industrial applications, which accounted for 50 percent of total physical silver demand last year, was 4 percent lower, totaling 588.7 Moz. This drop was largely due to weaker fabrication demand in developing countries and a stagnant global economy. On a regional basis, modest increases in industrial demand were posted in the United States and Japan, the second and third largest sources of industrial demand, respectively. Electrical and electronics use declined by 10 percent last year to 246.7 Moz, due to slower economic growth in developing countries and the continued weakness in computer sales.
There were several highlights within the industrial segment. Silver demand for photovoltaic applications rose 23 percent in 2015 to 77.6 Moz, marking the second consecutive year of increases in this sector, driven by strong growth in Chinese solar panel installations. Silver demand for ethylene oxide (EO) grew an impressive 103 percent to 10.2 Moz. GFMS estimates that 137.5 Moz of silver resided in EO plants around the world at year-end 2015, equivalent to 16 percent of last year’s silver mine production.
Silver’s use in brazing alloys and solders fell by 5.0 Moz and photography demand slid by 4 percent last year. The pace of decline in photography slowed considerably, to its lowest rate since 2004, as digital technology in the photography industry approaches maturity.
World Silver Supply and Demand (million ounces)
(totals may not add due to rounding)
Supply
| 2014 | 2015 | |
| Mine Production | 868.3 | 886.7 |
| Net Government Sales | – | – |
| Scrap | 168.3 | 146.1 |
| Net Hedging Supply | 16.8 | 7.8 |
| Total Supply | 1,053.3 | 1,040.6 |
Demand
| 2014 | 2015 | |
| Jewelry | 224.0 | 226.5 |
| Coins & Bars | 236.1 | 292.3 |
| Silverware | 60.7 | 62.9 |
| Industrial Fabrication | 611.2 | 588.7 |
| …of which Electrical & Electronics | 263.4 | 246.7 |
| …of which Brazing Alloys & Solders | 66.1 | 61.1 |
| … of which Photography | 48.5 | 46.7 |
| … of which Solar | 63.2 | 77.6 |
| … of which EO | 5.0 | 10.2 |
| … of which Other Industrial | 165.1 | 146.4 |
| Physical Demand | 1,131.9 | 1,170.5 |
| Physical Surplus/Deficit | -78.6 | -129.8 |
| ETF Inventory Build | 1.5 | -17.7 |
| Exchange Inventory Build | -8.8 | 0.3 |
| Net Balance | -71.3 | -112.5 |
| Silver Price, $per oz. | 19.08 | 15.68 |
Silver Investment & Price
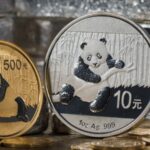
Identifiable investment, which includes physical bar investment, coins and medals, and exchange traded product (ETP) build, climbed 16 percent to a near record high in 2015. Silver coin and bar investment surged 24 percent to reach 292.3 Moz, the highest annual demand level in GFMS’ records, overtaking the previous high in 2013. Coin and bar demand accounted for 25 percent of total physical demand in 2015, the highest market share on record and up from just 5 percent a decade earlier. Silver coin and medal demand amounted to 134.1 Moz of demand last year due to unprecedented growth in several key markets, notably the United States and India.
Holdings in silver-backed ETPs declined by 17.7 Moz in 2015, finishing the year at 617.8 Moz. However, demand in this investment category has rebounded with ETPs reaching 640.0 Moz at the end of the first quarter 2016.
An extremely challenging year for nearly all commodities, along with a continued slowdown in Chinese economic growth and a stronger U.S. dollar, led to a lower average annual silver price of US$15.68/oz in 2015. However, this lower price environment helped to boost physical demand, particularly as long term investors viewed lower prices as key entry points in expectation of future price appreciation.
Silver Supply
Global silver mine production growth slowed to 2 percent in 2015 and reached a record 886.7 Moz. The mine production growth was attributable to stronger output in Peru, Argentina, Russia and India, while Canada, Australia and China had lower mine production, with the latter decreasing output by 3 percent. Primary silver mine production grew 5 percent, and accounted for 30 percent of global silver mine supply. The overall slowdown in mine production last year is expected to continue.
Primary silver co-product cash costs plus CAPEX fell by 11 percent to US$11.74/oz. This drop was driven by weaker local currencies, aggressively lower CAPEX, and lower fuel prices. The producer silver hedge book grew by 7.8 Moz in 2015, as fresh hedging more than offset maturing contracts.
Scrap supply was significantly down by 13 percent at 146.1 Moz, the lowest volume level recorded since 1992 and the fourth consecutive year of decline. Behind the decline were fewer collectors active in the market and some holding back material awaiting higher prices. Government sales of silver were again essentially nonexistent.
About the World Silver Survey, the Silver Institute and Survey Ordering Information
The Silver Institute has published this annual report on the global silver market since 1990, to bring reliable supply and demand statistics to market participants and the general public. The 26th edition of the Silver Institute’s World Silver Survey was independently researched and compiled by the GFMS team at Thomson Reuters. World Silver Survey 2016 was sponsored by 18 companies and organizations from North and South America, Europe and Asia. These firms are involved in most aspects of the global silver industry, from mining and refining to trading and manufacturing. Founded in 1971, the Silver Institute is an international industry association. Its members include leading silver producers, refiners, manufacturers and dealers.
Copies of World Silver Survey 2016 are available to the media upon request, and can be purchased by the public from the Institute’s website www.silverinstitute.org.
-
 Gold & Silver Testing Key Support Levels Again By
June 1 2026
-
 Gold & Silver testing Key Support Levels Again By
June 1 2026
-
 China’s Record Silver Stockpiling Triggers Supply Squeeze By
May 29 2026
-
-
 Gold Moving Higher on Positive Iran News By
May 29 2026