Elliot Wave suggests gold correction is over, heading for 200% gains
(January 16, 2012 - Alf Field)
There is a strong probability that the correction in the price of Gold has been completed. In Elliot Wave (EW) terms, the correction consists of three waves, an A wave down, a B wave rally and a final C wave decline. There is usually a relationship between the A and C waves. Often they are equal or have a Fibonacci connection.
The chart below is of the gold price using PM fixings:
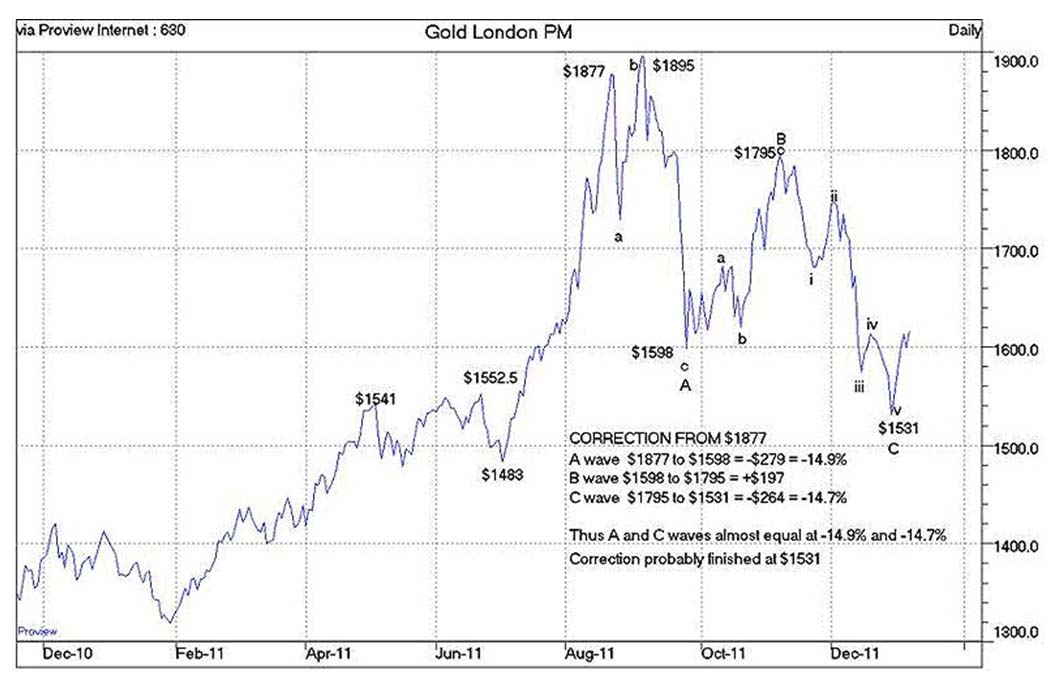
In this case, the A and C waves are equal in percentage terms at 14.5% and 14.7%. The overall decline from $1895 to $1531 is -$364 or -19.2%. My speech to the Sydney Gold Symposium last November - showed that the largest corrections in the previous Intermediate wave from $700 to $1895 were about 12% in PM fixings. The forecast was that the current correction from $1895 would be one degree of magnitude larger than 12%. A decline of 19.2% qualifies as one degree larger than 12%.
An interesting observation is that if 12% is multiplied by the Fibonacci relationship of 1.618, the result is 19.4%, very close to the actual 19.2% decline for the correction. The chart below is of the gold price in COMEX 2mth forward prices:
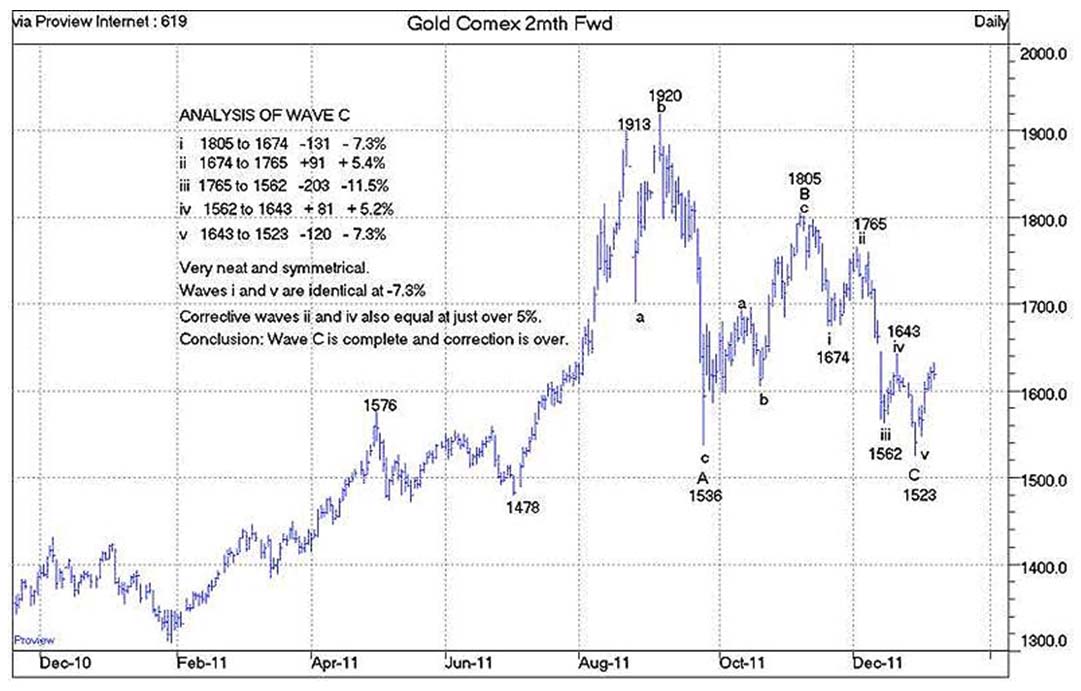
The Gold Symposium speech suggested that the correction would be between 21% and 26% in spot gold prices. The actual decline was from $1920 to $1523, a loss of -$397, or -20.7%. This is just below the target range but qualifies as one degree larger than the 14% corrections in the previous up move from $680 to $1913.
The C wave of the correction in the chart above reveals some symmetrical subdivisions which confirm that the C wave was completed at $1523 on 29 December 2012. With all the minor waves in place and with the correction being of the correct size, that should be the end of both the correction and Intermediate Wave II.
The probability of this analysis being correct is high, perhaps 75%? Smaller probabilities allow for: (i) this to be an A wave of a larger magnitude correction; (ii) the current correction becoming more complex, perhaps reaching the lower price targets (e.g. -26%); and (iii) the possibility of deflation, defaults and depression emerging, also testing lower price targets.
The up move just starting should thus be Intermediate Wave III of Major Wave THREE, the longest and strongest portion of the bull market. The gain in Intermediate Wave I from $680 to $1913 was 181%. The gain in Intermediate Wave III should be larger, at least a 200% gain. A gain of this magnitude starting from $1523 targets a price over $4,500. The largest corrections on the way to this target, of which there should be two, should be in the 12% to 14% range.
-
 Gold And Silver Continue To Build Excellent Support By
July 31 2026
-
 The Day Gold And Silver Turned Bullish For 2026 By
July 30 2026
-
 China’s Gold Imports Jump 89% In First Half As Prices Retreat By
July 30 2026
-

-

2 Comments
Leave a Comment