Yield Curve Inverted Even More - Is It Finally Time for Buying Gold?
(March 28, 2019 - Arkadiusz Sieroń)
The U.S. yield curve extended its inversion. Everyone and their brother knows that recession must definitely be on the horizon. We are all doomed, so gold can only go up now, right?
Yield Curve Inversion Gets Larger
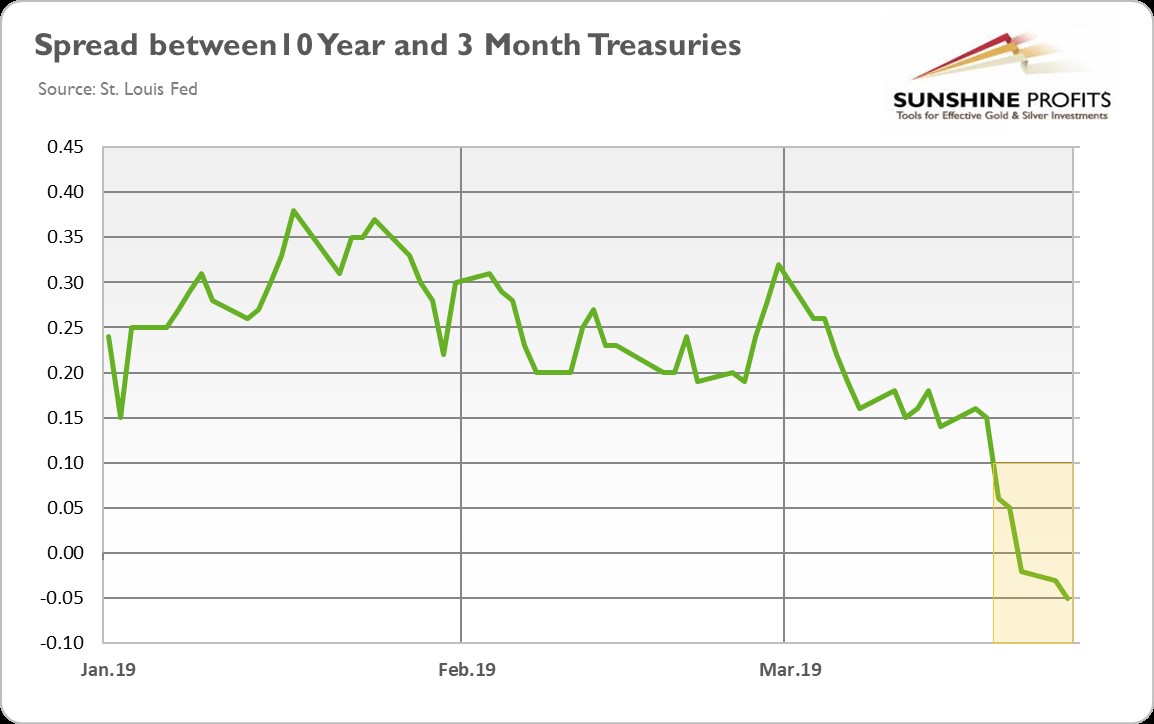
It’s getting more serious. On Friday, the yield curve inverted. This week, the spread between long-term and short-term rates has not only remained below zero, but it has dived further into negative territory. As the chart below shows, the difference between 10-year and 3-month Treasuries fell to -0.05 on Tuesday.
Chart 1: Spread between 10-Year Treasuries and 3-Month Treasuries from January 2019 to March 2019.
We are aware that many other interesting things are happening right now (take the fascinating Brexit saga, for instance), but the yield curve remains the hottest topic among investors with potentially enormous implications, so let’s continue our Tuesday’s deliberations and build on our analysis what the current inversion really means for the precious metals market.
To make a long story short, we are still not freaked out by the yield curve inversion and we urge gold investors to keep calm. Why? The key world is “macroeconomic context”. Let’s take a look at the chart below. It displays the yield curve and the unemployment rate, which is one of the most important macroeconomic gauges and recession indicators.
Chart 2: Yield curve (green line, left axis, spread between 10-year and 3-month Treasuries, in %) and the unemployment rate (red line, right axis, in %) from January 2000 to February 2019.
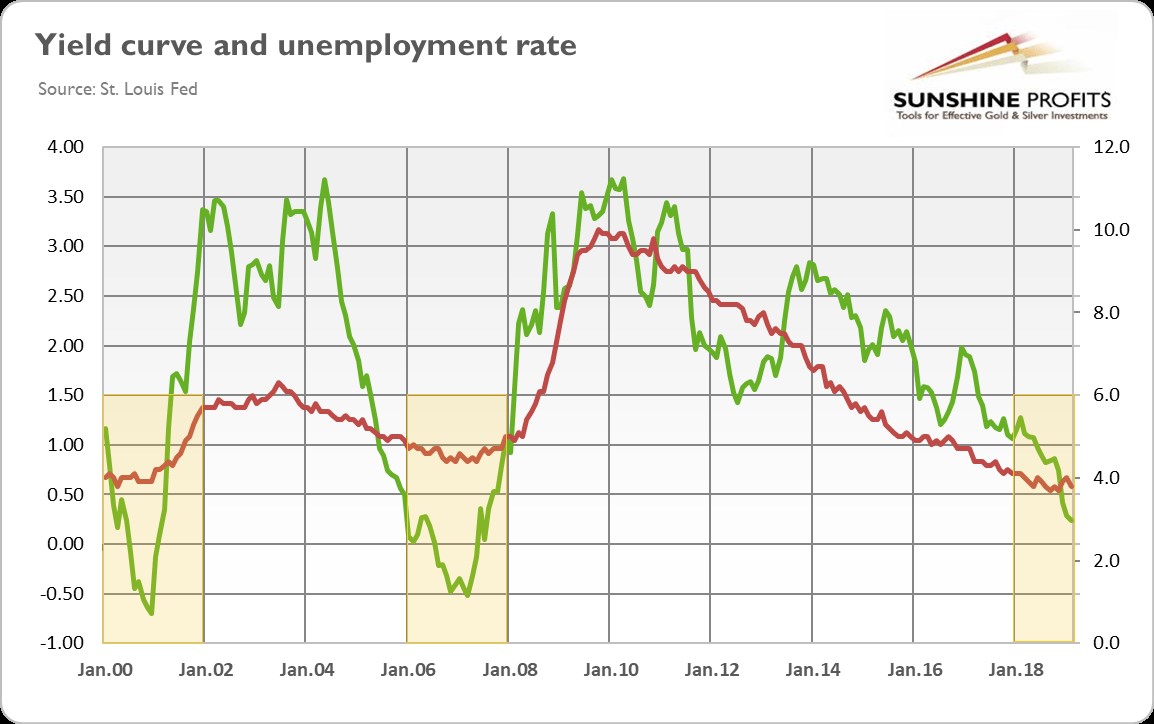
As one can clearly see, in two previous cases of the yield curve inversion, the unemployment rate was either flat or rising. But now, the unemployment rate does not send any evident recessionary signals which would make the gold bulls instantly happy. We can cite much more data that shows how the current condition of the American economy differs from the previous yield curve reversal. Actually, we have already done so in the March edition of the Market Overview. Here, we will present just one more chart, which shows the yield curve and the expected change in real income of households as calculated by the University of Michigan.
Chart 3: Yield curve (green line, left axis, spread between 10-year and 3-month Treasuries, in %) and the index of expected change in real income during the next year (red line, right axis) from January 2000 to January 2019.
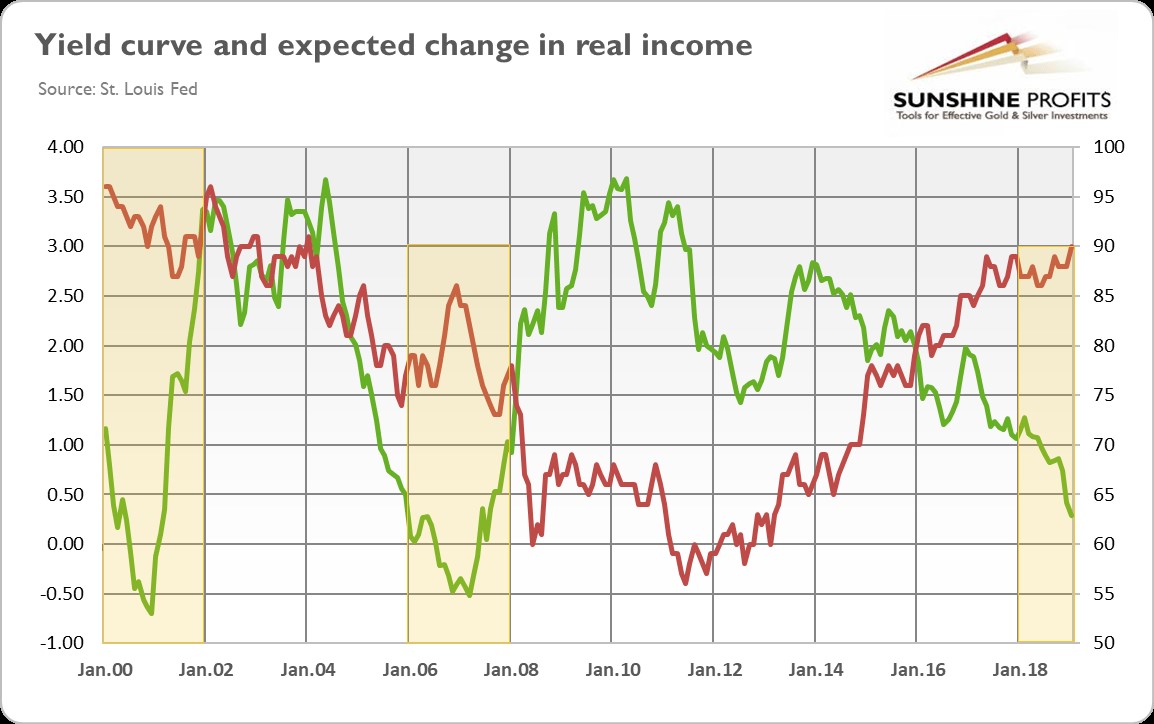
As one can see, after the previous yield curve inversion and right before the Great Recession, the index fell sharply. Now, the index has recently increased to the highest level since 2002. Our point is that, of course, we see some signs of weakness in the US economy, but not as many as in 2007/2008. It means that the recent yield curve is a disturbing signal, but it does not have to be the right signal.
Implications for Gold
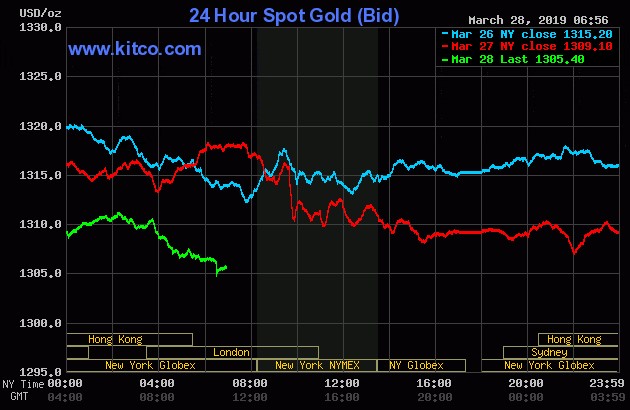
The yield curve inversion and the heightened recession fears may support the gold prices. However, as the chart below shows, gold’s reaction has been hardly euphoric so far.
Chart 4. Gold price from March 26 to March 28, 2019
One reason might be that the recession may rear its ugly head rather in the Eurozone than in the US. Yesterday, Mario Draghi said that the European Central Bank could further delay an interest rate hike and look at measures to mitigate the side-effects of negative interest rates. So, the US dollar may remain the number one choice among investors, creating a downward pressure on the gold prices.
Another issue is the reason why the yield curve inverted. It did not happen because the Fed tried to stop the overheating of the economy and prevent the rise of inflation. Not at all, the US central bank is far from wanting to kill the expansion. It’s rather reloading the chamber so as to have standard monetary tools available with which to fight the next crisis when it appears. So it is not the case that the short-term borrowing costs have increased abruptly, hitting the entrepreneurs who have to scramble now for liquidity. No, as the chart below clearly shows, the yield curve inverted because the long-term bonds yield declined, which means that the market expects interest rates in ten years to be lower than they are at present.
Chart 5: 10-year Treasury yields (green line), 2-year Treasury yields (red line) and 3-month Treasury yields (blue line) from January to March 2019.
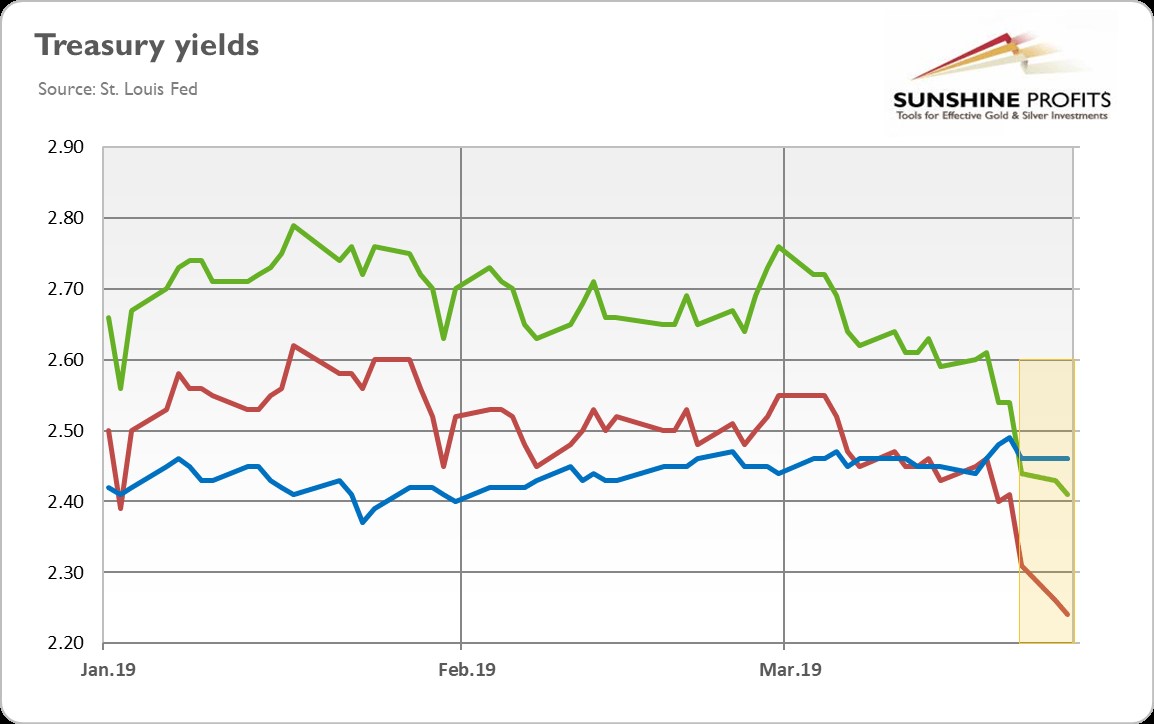
So, investors became more pessimistic. But, does it matter at all? After all, the current expansion is already the most hated expansion after the WWII. Last but not least, the chart above also indicates that the 10-year yields are still higher than 2-year rates, so only one type of spread has inverted so far (in contrast to previous pre-recessionary inversions). All this leads us to the conclusion that the fresh yield curve inversion does not necessarily signal the imminent recession (and if it does we still have about 12-18 months before it will arrive). Hence, although the more dovish Fed could be positive for the gold prices on the margin, the bulls will have to wait a little bit longer for the rally in the precious metals market.
-
 Gold And Silver Continue To Build Excellent Support By
July 31 2026
-
 The Day Gold And Silver Turned Bullish For 2026 By
July 30 2026
-
 China’s Gold Imports Jump 89% In First Half As Prices Retreat By
July 30 2026
-

-
